
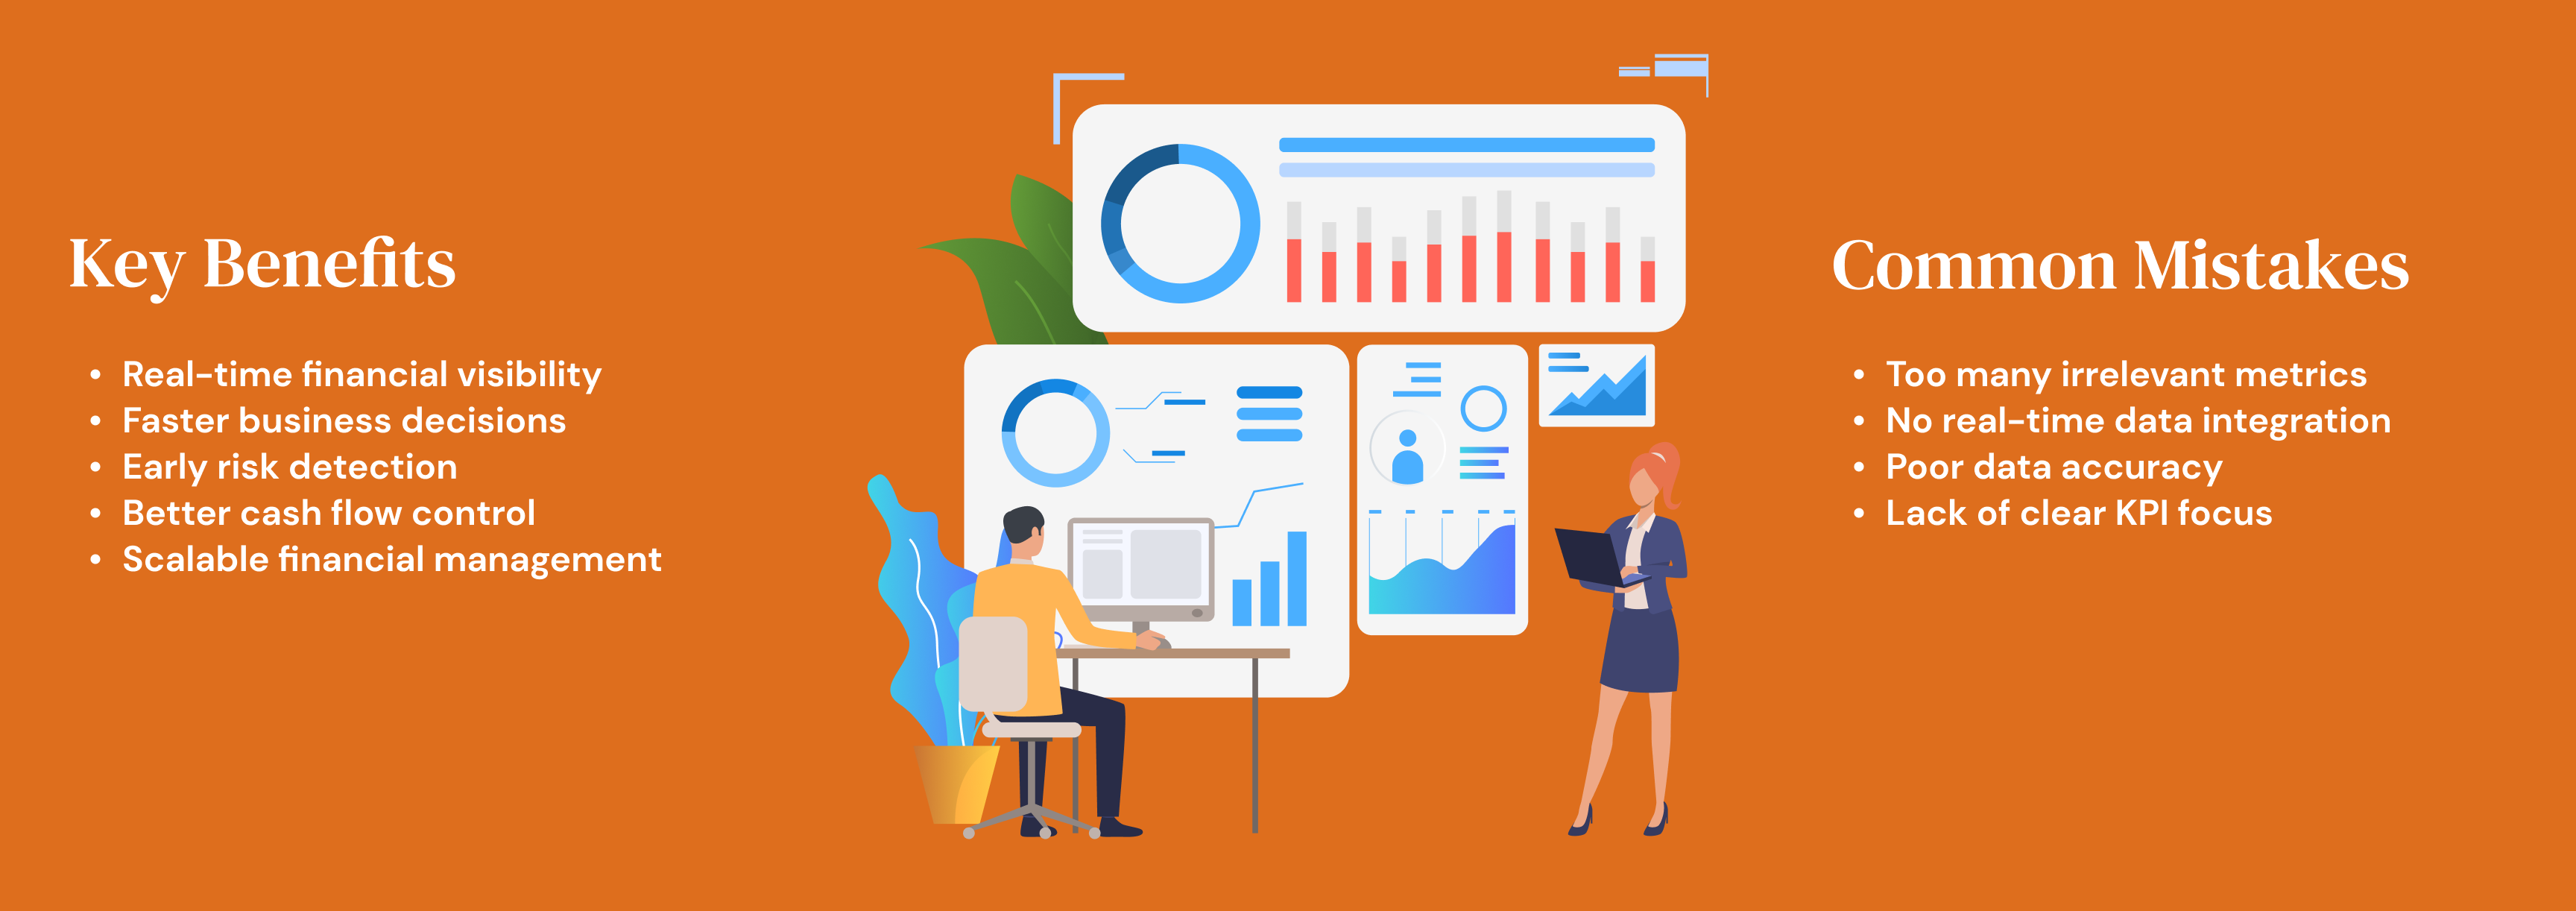
Financial dashboards modernize traditional reporting by turning static financial data into real-time, visual insights that support faster and smarter business decisions.
For growing companies working with structured finance partners like XMC Asia, dashboards are essential for improving visibility, control, and scalability.
What Is a Financial Dashboard?
A financial dashboard is a real-time visual tool that displays key financial metrics such as revenue, cash flow, expenses, and profitability in one centralized view.
It pulls data from systems like accounting software, ERP tools, payroll, and sales platforms.
Why Dashboards Matter
Traditional reports are:
- Slow
- Static
- Often outdated
Dashboards solve this by providing:
- Real-time updates
- Clear visuals
- Faster decision-making
Key Dashboard Components

Revenue Tracking
Monitors income trends and growth performance.

Cash Flow Overview
Shows money in vs. money out to prevent liquidity issues.

Profitability Metrics
Tracks margins and overall financial health.

Expenses Breakdown
Highlights spending patterns and budget control.

Receivables Monitoring
Tracks unpaid invoices and collection performance.
Conclusion
Financial dashboards transform finance from reporting history to managing performance in real time. They help businesses move faster, stay in control, and scale with confidence.
For growing companies, especially those supported by XMC Asia, dashboards are a key step toward building a modern, data-driven finance function.