
Profitability often looks simple on the surface—revenue minus expenses equals profit. But in reality, many businesses don’t truly understand where their margins are being generated or destroyed.
A proper profitability analysis breaks down performance by product, service, customer, and cost structure so leadership can see what is actually driving earnings—not just overall profit.
For growing organizations working with structured finance partners like XMC Asia, this level of visibility becomes essential for scaling efficiently and sustainably.
What Is Profitability Analysis?
Profitability analysis is the process of evaluating which parts of a business generate profit and which reduce it.
Instead of looking at total profit alone, it answers questions like:
- Which products are actually profitable?
- Which customers cost more than they contribute?
- Which services have the highest margins?
- Where are hidden operational costs coming from?
It shifts financial thinking from total performance → unit-level performance.
Why Total Profit Can Be Misleading
A company can appear profitable overall while still having weak or negative margins in key areas.
Common reasons include:
- High-revenue but low-margin clients
- Untracked operational costs
- Cross-subsidized services
- Inefficient delivery processes
- Poor cost allocation across departments
Without detailed analysis, profitable segments often “hide” unprofitable ones.
Key Dimensions of Profitability Analysis

Product or Service Profitability
This identifies which offerings actually generate margin.
You evaluate:
- Revenue per product/service
- Direct costs (COGS)
- Contribution margin
👉 Insight: Some “best-selling” products may be your least profitable.

Customer Profitability
Not all customers are equal.
You measure:
- Revenue per client
- Service cost per client
- Support intensity
👉 Insight: High-maintenance clients can reduce overall profitability significantly.

Departmental Profitability
Each department contributes differently to overall margin.
Examples:
- Sales efficiency
- Operations cost structure
- Support team overhead
👉 Insight: Internal inefficiencies often appear as hidden margin loss.

Geographic or Entity Profitability
For multi-location or multi-entity businesses:
- Regional revenue differences
- Cost variations per market
- Currency and compliance impact
Structured systems (such as those supported by XMC Asia) help standardize reporting across entities for clearer comparisons.

Channel Profitability
Businesses operating across multiple channels should compare:
- Online vs offline sales
- Direct vs partner channels
- Organic vs paid acquisition
👉 Insight: Some channels drive revenue but destroy margin.
Key Profitability Metrics You Should Track
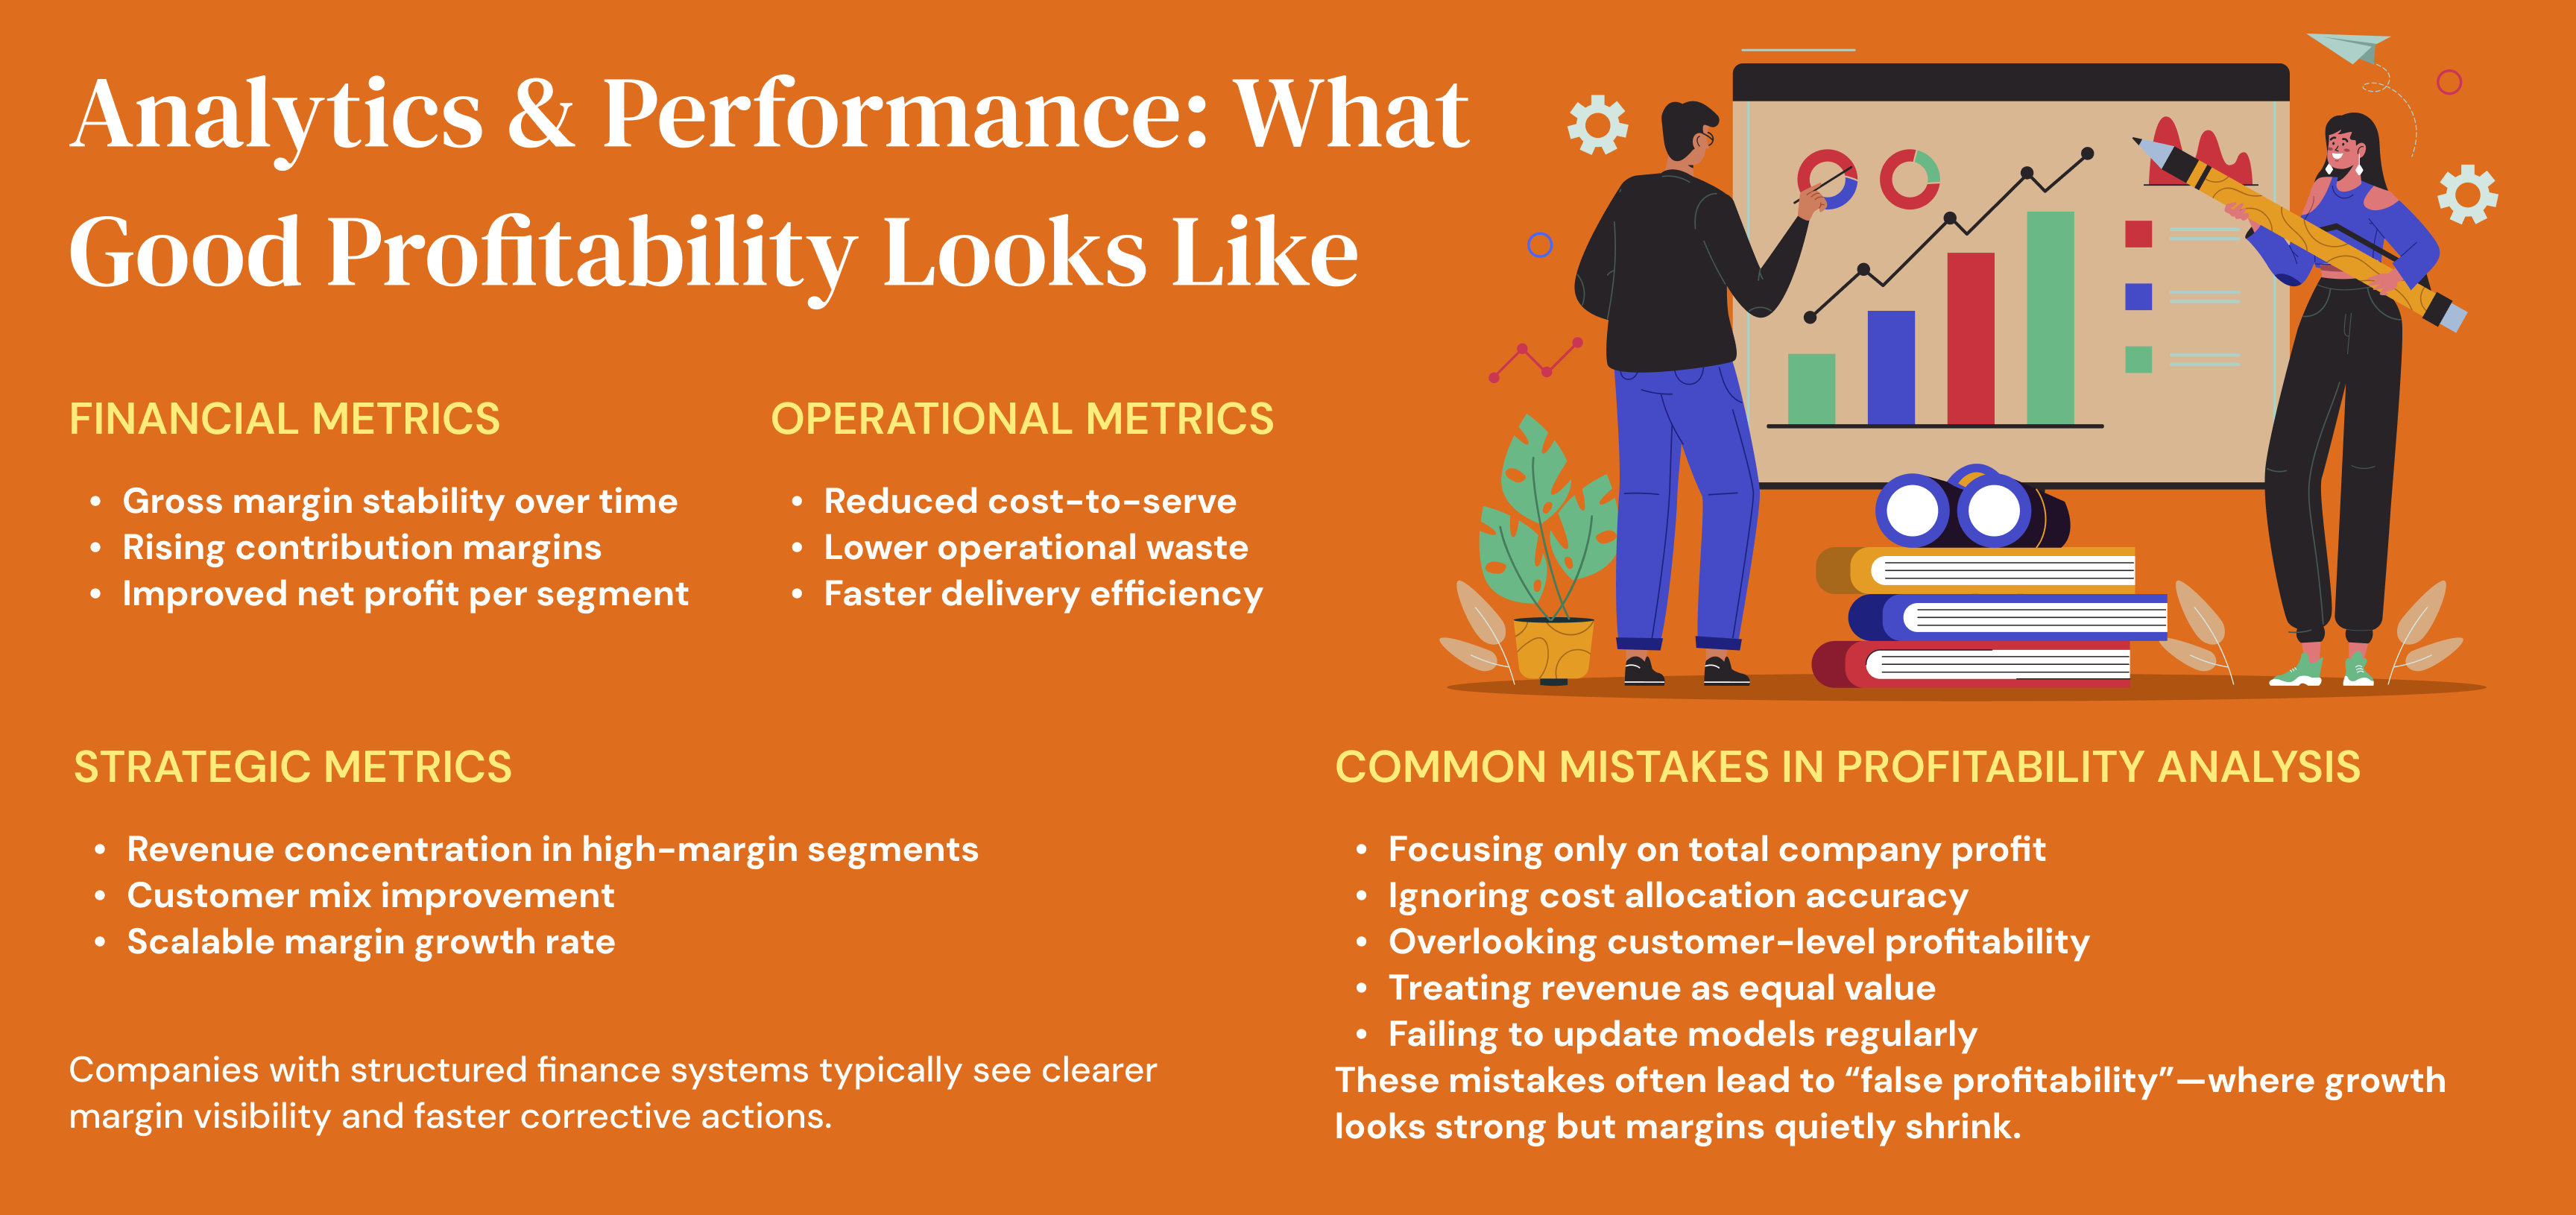
Gross Profit Margin
Measures efficiency of production or service delivery.
Contribution Margin
Revenue minus variable costs per unit.
Net Profit Margin
Final profitability after all expenses.
Customer Lifetime Value (CLV)
Total expected profit from a customer relationship.
Cost-to-Serve
Total cost required to deliver service to a customer or segment.
Where Margins Are Really Lost
Untracked Indirect Costs
Shared overhead not allocated properly across products or services.
Inefficient Operations
Manual processes, duplication, or workflow delays.
Discounting Without Strategy
Excessive price reductions reduce margin sustainability.
Poor Customer Segmentation
Treating all clients equally regardless of profitability.
Scaling Low-Margin Segments
Growing revenue without margin discipline reduces overall profitability.
How to Improve Profitability Visibility
1. Implement Cost Allocation Models
Assign costs accurately to products, clients, and departments.
2. Use Real-Time Financial Reporting
Move away from delayed monthly insights to dynamic dashboards.
3. Segment Financial Data
Break down performance by:
- Customer type
- Product line
- Region
- Channel
4. Standardize Financial Systems
With structured finance frameworks (often supported by XMC Asia), businesses can unify reporting across entities and departments for consistent analysis.
5. Review Margins Monthly, Not Annually
Profitability shifts quickly—delayed insights lead to lost opportunities.
Conclusion
True profitability is not about how much revenue you generate—it’s about where that revenue comes from and how efficiently it is earned.
A strong profitability analysis helps businesses:
- Identify high-value segments
- Eliminate margin leaks
- Optimize pricing and cost structures
- Make smarter growth decisions
For scaling companies, especially those working with structured financial partners like XMC Asia, profitability analysis becomes a core tool for sustainable expansion—not just financial reporting.
References
- Investopedia – Profitability Ratios
- Corporate Finance Institute – Profitability Analysis